Dianne Glasscoe Watterson, RDH, BS, MBA
AS BUSINESSES, dental practices are comprised of three main departments: the business desk, the restorative department, and the hygiene department. In this article, we will focus on the hygiene department as a major factor in dental practice success. We will examine several industry benchmarks and discuss ways to improve hygiene department efficiency and productivity.
When to hire a hygienist
The most valuable commodity any dentist possesses is his or her time. How the dentist uses time is an important consideration in business success. When a dentist chooses to perform procedures that could be delegated to a qualified auxiliary, the dentist's time is being used inefficiently.
There are only two reasons that a dentist should be doing hygiene procedures. First, if the practice is a start-up practice with very few patients, the dentist may need to perform hygiene procedures just to stay busy. It takes from 800-1,000 active patients to keep one full-time hygienist busy. So, in the start-up stage, the practice may need a hygienist only part-time until it grows to sufficient size to employ a hygienist full-time. If a dentist spends even 25% of his or her time performing hygiene procedures, he or she loses hours that could have been spent performing more productive restorative procedures.
The other reason for not employing a hygienist is if the practice is located in an area where there are no qualified hygienists. That is rarely the case today, and in most states there is an oversaturation in the hygiene job market. Many states are reporting that hygiene graduates are having great difficulty finding full-time work. As an example, a North Carolina dentist who posted a hygiene position on Craigslist received 30 resumes in two days.
Hygiene department industry benchmarks
Benchmarks are industry standards that are used as a measurement of achievement or excellence. Here are some typical hygiene department benchmarks:
• The hygiene department will contribute 25%-35% of gross practice production.
• 75% of restorative needs are discovered in hygiene patient visits.
• One-third of hygiene codes will be periodontal codes.
• Downtime should be no higher than 5%-8% of available time.
• Hygienists should produce about three times their wages.
• Hygienists are optimally positioned to promote restorative and elective procedures.
While benchmarks are meaningful, it is important to recognize that they are not always applicable. Let's look at how some of these benchmarks might be skewed.
The first benchmark assumes that the doctor-to- hygienist ratio is one doctor to one hygienist, which is not always the case. In some situations, a solo doctor may employ multiple hygienists, and the hygiene department may contribute well above 35% of gross production. When the hygiene department contributes an inordinately high percentage of gross production, it is usually a sign of a weak restorative department. The hygiene department production may not follow the benchmark if the practice is in the cosmetic dentistry market (5% or less practices of nationwide), and the doctor is performing a predominance of high-dollar procedures. In this case, the hygiene department may contribute less than 25% of the total gross production.
The third benchmark is related to periodontal coding. While we like to see a healthy number of periodontal codes (e.g., D4341, D4342, D4910) in the procedure mix, this metric can be skewed in two ways. First, if there are not at least 20-25 new patients per month per doctor, the practice may not see as many periodontal codes. New patients offer the best opportunity for periodontal treatment in many practices, but a lack of new patients causes the practice to "stagnate." The majority of established patients may be well maintained and free of periodontal problems. Second, periodontal disease may be underdiagnosed in some practices due to lack of an established periodontal program, a lack of time and assistance for hygienists who need to perform periodontal charting, or both. When hygienists are time crunched, the most omitted procedure is the periodontal charting, simply because it is so time-consuming to chart and record solo. Hygienists are more likely to periodontal chart when the barriers to charting are removed by making assistance available or investing in a voice system.
The impact of downtime
Of all the systems in a dental practice, there is nothing more important than the schedule. Yet, it is common to see one to two open appointments in hygiene each day. If the average cost of a hygiene visit is $150, two openings per day in hygiene cost $60,000 per year in lost productivity. Downtime in the hygiene schedule not only means a loss of productivity-there is also a corresponding rise in overhead costs, and the restorative schedule will be negatively affected by undiagnosed patient needs. Downtime is the greatest profitability killer in the practice. Let's examine how to measure downtime.
1. Tally the units of time that the hygienist is available to see patients in one month. If the practice is on a 15-minute time increment, there will be four time units in an hour. An 8-5 day with an hour for lunch would mean 32 time units per day. If the office is on a 10-minute time increment, there are six units in an hour. An 8-5 day would have 48 time units.
2. Tally all the open time units in the schedule. Do not count lunch as open time. Also, do not count time that has been blocked off for training or staff meetings.
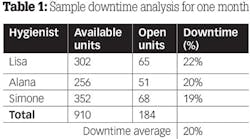
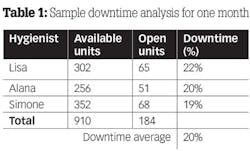
3. Divide the available unit total into the open time unit total (big number into the small number). Move the decimal two places to the right. This is the downtime percentage. Round up anything that is .5 or higher. See Table 1 for an example.
The acceptable downtime goal should be 5%-8% or less. As you can see from this example, this practice has excessive downtime.
Now let's analyze the cost of the downtime in Table 1. First, we have to arrive at the average production over a period of time (table 2).
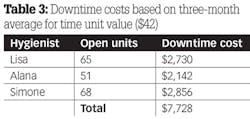
By dividing the number of units into the total production, we can compute the dollar amount of each unit of time. The three-month average can also be calculated from these data: add the production per unit totals and divide that number by the number of hygienists, then the number of months (table 3). In this scenario, the average unit of time is worth $42.
We know that the average downtime cost to the practice for one month was almost $8,000. If this is multiplied over 12 months, the average raw cost of downtime would be $96,000 in a year. However, the costs do not stop there. There was also the cost of the hygienist's hourly pay (i.e., the wages being paid when he or she is not producing) and the loss of any restorative dentistry that may have been diagnosed.
As you can see from this example, downtime is very costly and can destroy a practice's profitability. In order to correct the situation, practices need to track and analyze downtime. If demand for services has fallen, the doctor can either reduce available hours or engage in some effective marketing to increase the number of new patients. It would be advantageous for the practice to concentrate on reactivating unscheduled patients and improve the show rate through better communication. Is the business desk understaffed? Does the business assistant need some training in systems or better communication? Does he or she understand the importance of proper scheduling? Is the business assistant motivated to improve?
The salary-to-production ratio
The fifth benchmark concerns the hygienist's salary-to-production ratio. The industry standard is that a hygienist should produce around three times his or her wages; in other words, the ratio should be about 33%. One caveat: This benchmark can be skewed if hygiene fees are artificially lower than normal. Some doctors raise fees on restorative procedures but keep hygiene fees low in an effort to promote an illusion of low fees to patients. In all fairness, hygiene fees should be raised when restorative fees are raised.
Let's compare two hygienists. The following examples show how many of each procedure code was performed over a three-month period (table 4). It also shows each hygienist's wages, then a computation of the salary-to-production ratio, which is calculated as a percentage (i.e., by dividing production into wages and moving the decimal two places to the right).
This example shows Katherine has a 47% salary-to-production ratio, which is well above the benchmark of 33%. The high ratio could be a function of low production because of excessive downtime, but what stands out in the analysis is the lack of periodontal procedures. Periodontal therapy is the most productive procedure for hygienists. Notice that there were only two quads of periodontal debridement and there were no site-specific or periodontal maintenance procedures. Most likely, periodontal problems are being underdiagnosed in this practice. It seems unreasonable to believe that there was not one pocket in a total of 228 patients seen.
Christy's analysis is more encouraging. There was a total of 83 periodontal codes (D4341, D4342, D4910), and it appears Christy is engaged in identifying periodontal problems and ushering patients into definitive treatment. Periodontal treatment is 36% of codes. Her salary-to-production ratio is under the benchmark, and an increase in pay is reasonable and appropriate.
A hygienist's intangible value
Dental hygienists bring more to the dental business than raw production numbers. Equally important is a hygienist's understanding of restorative and elective procedures and identification of patients that would benefit from the doctor's skills. Hygienists are in the best position of all the dental auxiliaries to promote restorative procedures. But in order to promote something, the hygienist must have a clear understanding of those procedures and be able to broach the subject of elective dentistry in a way that piques patient interest without overselling. They need to feel confidence in the doctor's ability to deliver excellent results in order to promote advanced restorative and cosmetic procedures.
Doctors should take their whole team to courses aimed at elective procedures so staff members can learn along with the doctor. Hygienists should be invited to observe certain elective procedures while being performed so they can better understand the process and learn how procedures are done. Hygienists should also track the amount of elective dentistry that is presented and scheduled.
Improving hygiene department productivity
There are several good ways to improve hygiene department productivity.
• Improve scheduling. Don't automatically give every patient one hour-schedule for needs. Be proactive in deciding what procedures will happen on the next visit, and schedule appropriately.
• Decrease downtime with effective communication skills. Identify chronic broken-appointment offenders. Never leave reminder messages for new patients or people with a history of disappointment, but speak with them directly, even if they have to be called after hours. Make sure every patient that misses an appointment is contacted. Reactivate patients that are past due.
• Improve the procedure mix by identifying periodontal problems and ushering the patient into definitive care. Keep the "periodontal radar" engaged at all times.
• Offer adjuncts such as power brushes, water lavage tools, and intrapocket therapies when appropriate.
• Conduct full-mouth, six-point comprehensive periodontal charting and recording on all adult patients once per year.
• Implement assisted hygiene. The assisted model is undoubtedly the best way to increase hygiene department efficiency and productivity without compromising quality.
In conclusion
Knowing that the hygiene department typically drives the rest of the practice, the savvy 21st-century dental business owner understands two important facts: hygienists must provide excellent patient care, and doctors and hygienists should be interested in the specific metrics associated with the hygiene department. Specifically, they should understand what percentage of the total gross production the hygiene department provides, the percentage of periodontal procedures, the salary-to-production ratio, the downtime percentage, and the monetary amount of elective dentistry presented and scheduled. When the metrics reveal areas of concern, hygienists and doctors need to work together to improve practice statistics and overall efficiency.
Dianne Glasscoe Watterson, RDH, BS, MBA, is a consultant, speaker, and author. She helps good practices become better through practical on-site consulting. Please visit Dianne's website at www.professionaldentalmgmt.com. For consulting or speaking inquiries, contact Dianne at [email protected] or call her at (336) 472-3515.
