By Matthew R. Lark, DDS, MAGD, FICD, FACD
Who knew the Beatles provided funding for the early models of CAT scans?
For more on this topic, go to www.dentaleconomics.com and search using the following key words: computerized axial tomography, CAT scanners, Cone Beam Computerized Tomography, Hounsfield units, orthogonal reconstruction.
Computerized scanning technology has been in use for over 30 years. Originally, it was called Computerized Axial Tomography or CAT. Hospital-based CAT scanners were radiation intensive, supine gantry-style units which required large suites in radiology centers. The computer itself would take the space of an entire room. Except for the occasional trauma or involved pathology patient, dentists really did not utilize CAT scan technology. Today, with advances in miniaturization and computer software and a revolution in imaging, CAT scan technology has moved from the hospital to the private dental office.
The goal of this article is to provide dental personnel with an overview of the science and terminology used in Cone Beam Computerized Tomography (CBCT). The clinician will need to become familiar with terms such as scan height, slice thickness, and scan diameter. Many important concepts unique to CBCT — such as radiation dosage, volume averaging, voxel size, attenuation, Hounsfield units, orthogonal reconstructions, surface-rendering, multiplaner reconstruction, axial-corrected temporomandibular joint sagittal and coronal tomography, DICOM format, 3-DVR, stereolithographics, and data portability — will be discussed.
Basic radiographic studies, such as panoramic or cephalogram views, are diagnostically-driven sectional views which can be obtained from the volume of data generated by CBCT scans. One of the benefits of CBCT is the capability of measuring areas of interest using specialized digital tools. When measuring structures using CBCT, the readings are both accurate and precise; therefore, structures and pathology can be serially calculated indicating subtle dimensional changes of lesions or structures. The digital environment enables not only linear measurement, but also volumetric calculation (i.e., airway volume) and tissue or bone density.
History of CAT and CBCT
CAT scan technology was developed in the 1970s by British engineer Godfrey Hounsfield of EMI Laboratories, England, and physicist Allan Cormack of Tufts University, Mass. For their work, they were awarded Nobel Prizes. The term "CAT scanning" (Computerized Axial Tomography) comes from the Greek "tomos" which means "slice" or "section" and "graphia" which means "describing." It took several hours to acquire the raw data for a single scan or "slice" with the first CT scanner developed by Hounsfield in his lab at EMI, and it took days to reconstruct a single image from this raw data.
We can thank the Beatles — John, Paul, George, and Ringo — for providing funding for the early models of CAT scanners. The success of the Beatles generated research dollars for their recording company, EMI, which in turn developed the CAT scan. EMI developed the technology at its research arm. Computerized tomography was originally known as the "EMI scan." Ironically, this company is far better known for its music and recording business than for its much more important contribution to health care.
Hounsfield units
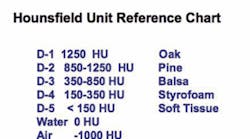
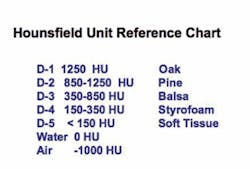
Hounsfield units (HU) are a quantitative measure of the radiolucency of different materials in a CAT scan. Hounsfield units allow us to differentiate the relative densities of various biological structures. The Hounsfield scale ranges from air at -1000 HF, through water at 0 HF, up to +1000 HF for cortical bone, +400 for cancellous bone, and 2000-3000 for metallic structures. Each pixel in the CT image is assigned a value between the -1000 and +1000 range. HUs are helpful when assessing the bone density of the potential implant site. Bone density is graded from D-1 through D-4, as shown in Figure 1. A Hounsfield reference chart can be done in any font or arrangement. But bone hardness can vary from bone density when certain bone allografts are imaged.
The attenuated radiodensity of imaged tissues is displayed in varying hues of gray. It also can be color-coded to match specific Hounsfield units. CBCT scanners offer between 6 and 14 bit gray-scale capability, or over 16,384 shades of gray. This characteristic allows selection of areas of high or low density which can be highlighted for better visualization of tissue variants. The outline of a cystic area can be made to stand out from its surrounding bone. Higher radiation, medical 64-head CT is more sensitive to the subtle variations of HUs and therefore better for reading soft tissue than an in-office CBCT.
Pixels and voxels
The term pixel is a contraction derived from the words picture and element. Pixel represents the smallest single component of an image on a two-dimensional grid. The intensity, hue, and value of a pixel can vary, thus displaying multiple combinations of data elements that, when projected using an electronic display grid or printed on a photographic medium, will form an accurate rendering or image. The image can be viewed in color or as a black and white image using a gray scale. The attenuation of an X-ray signal by an object or tissue will determine the value and intensity of the individual pixels.
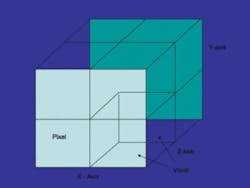
A voxel is a volume pixel. The voxel adds the third dimension (3-D) to the digital image by adding the z-axis (depth) to the x-axis (width) and the y-axis (height). Stacks of these volumetric boxes of data allow 360 degrees of virtual manipulation of imaged objects (see Figure 2).
Figure 2: Pixel and voxel diagram. Voxels are 3-D pixels.
The voxel becomes the smallest element in the 3-D environment. When viewed as a digital image, the pixel size controls the resolution. The smaller pixel size yields a higher resolution image, and conversely, the larger the pixel size, the lower the resolution or quality of the image.
In CBCT, pixel size can vary from .12 mm to .4 mm. The lower pixel-size image takes more exposure time (20 to 40 seconds) and more radiation. It is very susceptible to movement distortion. Thus, even though small pixel-size images lend more definition to smaller object areas, the risk of movement distortion makes it impractical for most applications. Therefore, imaging subtle pathology such as caries, root fractures, or periodontal bone loss is not practical due to movement-related distortion.
CBCT acquisition
Obtaining a CBCT scan is a relatively simple procedure. The scan parameters of image size and pixel size are determined according to the goals of the desired study. A cephalometric study requires a full-head image 22 cm vertical, but an implant study may only require a 6-10 cm vertical, enough height to image the mandible and maxilla. Larger height, wider diameter, and higher resolution studies produce more radiation exposure and usually take more exposure time. The patient must be restrained from all inadvertent movement.
The CBCT scanner
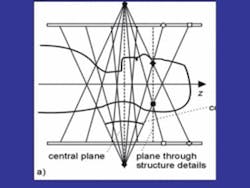
The cone beam scan acquires the image using a radiation source opposing a target sensor on a rotating mechanism. The X-ray is focused (collimated) at its source and then diverges into a fan shape by the time it reaches the detectors, hence the name cone beam. This fan beam collimation is the major difference between the medical CT scanners and cone beam scanners. CBCT sensors collect the data directly onto amorphous silicone plates or indirectly using image-intensifier detectors. CBCT allows the X-ray signal to be pulsed rather than continuous, thus decreasing the overall exposure to the patient. A 20-second scan may only contain 3.5 seconds of radiation exposure. Figure 3 shows the cone beam in motion.
Figure 3: Illustration of cone beam in motion during scan.
Radiation dosage
Effective radiation dosages for CBCT scans are approximately 68 µSv. (micro-Severts). This is less than half the level of exposure from a full-mouth series of radiographs at 150 µSv. Normal daily background exposure is about 8 µSv or about 3 mSv (milli-Severts) per year. A typical panoramic radiograph is 26 µSv, but a medical CT can expose as much as 1,200 to 3,300 µSv per scan. The amount of radiation used in CBCT examinations is small, and the benefits outweigh the risk of harm.
Scatter occurs when the X-ray beam hits a dense object such as metal from a crown or filling. Scatter signal does not affect the resolution of the high-contrast anatomy. Therefore, the image degradation from scatter is minimal in dental CBCT (except in areas of extensive restoration). Even in this situation, though, sophisticated reconstruction algorithms can correct for the scatter.
Data compilation
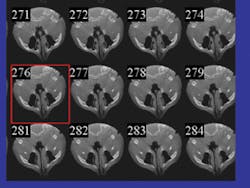
The CBCT scanner acquires hundreds of slices per rotation (see Figure 4). Once obtained, the computer processes these slices by assembling them into a full cylinder-shaped volume analogous to a stack of compact discs. The various proprietary software applications compress and compile the data into the DICOM format for use in the various applications.
Figure 4: Axial slices from a cone beam scan. Hundreds of reformatted axial slices comprise the volume of the scan.
DICOM (Digital Imaging Communication in Medicine) is a format of medical imaging data standardized by the ACR/NEMA (American College of Radiology/National Electrical Manufacturers Association) to allow the digital transfer of data between various diagnostic-imaging equipment and software. The rapid adoption of the current standard, DICOM-3, has opened new opportunities for health-care organizations to increase the quality and cost-effectiveness of patient care.
Patient file sizes from various CBCT scanners can range from 5 megabytes (I-CAT®) to 700 megabytes for other systems. Larger file formats demand considerable storage capacity. Such large files may be difficult to share over the Internet with third-party users. However, as compression technology improves, these data storage and transport issues will probably be resolved.
Multiplaner reconstruction
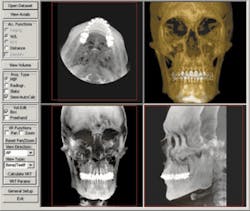
CBCT scanner software sorts the data into a multiplaner reconstruction which has three interactive views: the coronal (x-y axes), the sagittal (z-y axes), and the axial (x-z axes). Plane locator lines can be moved within each section, allowing scanning through the entire volume of information in the three planes. The scanning function allows for a rapid means of inspecting for gross anatomical variants and locating areas of interest useful in designing follow-up studies for more precise viewing.
Orthogonal studies
When viewing the axial views, a specialized study can be constructed using a perpendicular line in either a straight or curvilinear form. These are called orthogonal studies to highlight various cross-sectional regions. The depth or length of the cross-sectional zone can be varied to include a greater or lesser volume of the image area. The acuity of the view increases as the image size decreases. Volume averaging will make areas of interest less distinct as the attenuated data is averaged throughout the thickness of the viewing area. Thick sections may display more information about shape and contour such as airway, facial asymmetry, or gross bone defects, but thin sections are more useful for subtle anatomic deviations such as cysts, caries, or fractures.
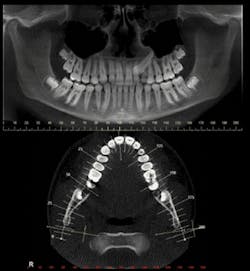
Figure 5: Panoramic orthogonal plane. This image depicts the panoramic orthogonal reconstruction.
A common orthogonal cut is the panoramic planing. (see Figure 5). The panoramic plane can be formulated widely enough to include mandibular-maxillary complex, or either arch can be selected by a thinner cut which shows a more accurate virtual representation.
The temporomandibular joints can be highlighted with an axially-corrected slice, thus displaying measurable joint spaces, cortical outlines, and marrow spaces.
Maximum intensity projections
Maximum intensity projections (MIPs) are images which show the compilation of the entire volume of data and projects in the visualization plane (the voxels) with maximum intensity. The MIP (see Figure 6) gives the illusion of a 3-D image and is the basis for 3-D software (3-DVR) applications. This software renders the volume of data in a format which can be manipulated as a single object and then rotated 360 degrees. Virtual cropping allows visualization of component parts of the object, such as an impacted tooth, without the superimposition of visual obstruction from overlaying or underlying structures. This property of CBCT allows studies of juxtaposition of adjacent structures and precise measurements of the volumetric and linear size of selected objects.
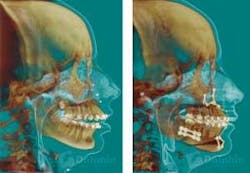
3-D volumetrics can be combined with 3-D photography that melds the surface rendering of the cone beam scan with the dentofacial soft tissue information of the photograph. Bony and soft tissue landmarks can be recorded and studied in a 3-D environment. The traditional cephalometric analyses are based on a two-dimensional system. The advent of new software applications (such as Dolphin 3-D®) will revolutionize the evaluation of dentofacial and skeletal growth and development, and change the future of orthodontic and orthognathic treatment-planning (see Figure 7).
Surface rendering treats the object as if it has a surface of a uniform color. In surface rendering, shading is used to show the location of a light source. Some regions are illuminated, while other regions are darker due to shadows. When surface rendering is combined with volume rendering, it becomes possible to highlight and colorize distinct regions of hard and soft tissues, thus providing a more accurate visualization of borders of pathology to vital structures. Virtual dissection further fine-tunes and pinpoints exact anatomical position.
CBCT technology is perhaps the most significant advance in dentistry since the high-speed handpiece. CBCT has already revolutionized dental diagnosis and treatment-planning, and as the scanner technology advances and new software applications are developed, the gap that exists between dental and medical radiology will close. CBCT will play a defining role in the study of growth and development and of aging. It will fundamentally alter the diagnosis of dental pathology and surgical treatment-planning.
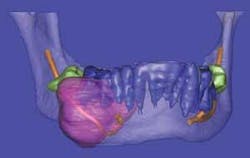
Figure 8a: SimPlant® reconstruction of ossifying fibroma.
Stereolithography
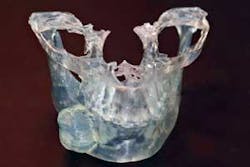
Stereolithography is also known in the industrial world as rapid prototyping. Dental CBCT scans processed using Sim Plant® software can be digitally transformed for creating stereolithographic models. Rapid prototyping allows the fabrication of physical replicas of 3-D computer-generated models in a layered approach. After the 3-D rendition is generated, software slices the file from top to bottom and then the slice data is sent to a machine that fabricates the part slice by slice. In dentistry, the fabrication of biomodels gives the oral surgeon a full-volume plastic template to plan surgical procedures, fabricate custom-engineered joint- and bone-replacement prostheses, and model facial-plastic reconstructive procedures (see Figures 8a and 8b).
Figure 8b: Stereolithographic model of same lesion used for surgical treatment-planning.
Research
Dental scientific research will be enhanced by CBCT as evidence-based concepts can be more accurately measured and improved. Portability of data will expand databases available for wider-based, multicenter epidemiologic studies. Future software applications can be applied to new and archived databases, giving the scientist the ability to chronologically measure structural change over time.
A new world of diagnostic capabilities
CBCT is the new hallmark of dental imaging. While it can look very challenging technically for the neophyte, the dental software has user-friendly interfaces which simplify the technical experience so that dentists can readily apply their skill and knowledge. The low radiation CBCT scan offers safety and a wide variety of clinical applications for dentistry and medicine.
Certainly the technology associated with CBCT can be daunting to the dentist at first glance. There are many teaching centers for those interested in further education on CBCT. Many are listed on the Web site http://cone beam.com, where information from many manufacturers can also be found. CBCT has opened up a new world of diagnostic capabilities for dentistry, and these exciting changes are helping dentists provide safer, more predictable, and better diagnostic radiological protocols than ever before.
Matthew R. Lark, DDS, MAGD, FICD, FACD, has practiced general dentistry in Toledo, Ohio, for the past 26 years. He is the current president of the American Academy of Orofacial Pain. He is also an assistant clinical professor at the University of Toledo Medical Center, Department of Dentistry. He became a Diplomate of the American Board of Orofacial Pain in 1995, is a Fellow of the International Congress of Oral Implantologists, and a clinical instructor at the Kois Center. Currently, Dr. Lark is conducting clinical research using cone beam radiology as a diagnostic aid for implantology, orofacial pain, head and neck pathology, and sleep disorders. You may contact Dr. Lark by e-mail at [email protected].
