Your process map to success
by Brett O'Donnell and Joseph O'Donnell, DDS
Three blind men were walking down a path when they encountered an elephant. Each man felt a different part of the elephant and described what it was like to the others. The first man felt the elephant’s trunk and said, “An elephant is just like a snake.” The second man felt the elephant’s tail and said, “That can’t be right. An elephant is like a rope!” The third man felt the elephant’s side and said, “You’re both wrong. An elephant is like a wall.” They argued until a wise man said, “You’re all right. You were feeling different parts of the elephant, and each part you described contributes to the whole.”
For a dental office, the impact of this proverb is staggering. The systems in a dental office are highly complex and require extensive training to master. Not to mention that the people working in a dental environment have a wide range of backgrounds and expertise, giving them a wide range of interpretations of those systems.
In a study conducted by Marcus Buckingham and the Gallup organization, employees at Best Buy were asked, “Do you know what’s expected of you at work?” In the most successful stores, 91 percent of the employees strongly agreed that they knew what was expected. In the worst-performing stores, only 27 percent agreed ... and it is our opinion that performing dentistry is more complicated than selling electronics!
So, how can you make sure that everyone in your office knows what is expected of him or her and fully understands how the systems in your office interrelate? Systems engineers have been studying this problem for decades and have found a tool called process mapping to be an incredibly effective solution.
Process mapping is an engineering tool that visually depicts all the steps of a process in a way that emphasizes critical thinking, usability, and efficiency. While process maps are similar to the “flow charts” that many people are familiar with, their application can range from improving training documents to building advanced computer simulations that can model years of business in just a few minutes.
Process maps can help dental practices by putting the interrelating office systems into perspective and showing how each task, system, and team member relates in a way that is easy to understand. You don’t have to be a systems engineer to use process mapping; we’ll show you how to apply this incredibly powerful tool to map the systems of your practice in a way that will make the most of your current resources.
Getting started: define the process
The best way to get started is to use multicolored sticky notes in a clean place where you can spread them out, such as a white board or large desk. This way you can focus on the specific steps and how they are related without worrying about format or design.
- Determine the primary focus of the process map. Who or what is going through the process? In a dental office, the focus is usually the patient or a team member, but it can also be an inanimate object such as a patient chart or operatory.
- Determine the scope of the process map. In general, this is a clearly defined beginning and end of the process. This helps set guidelines for the size and detail of the process map.
An example is mapping out a new-patient visit, from the time the patient enters your office through his or her departure.
The focus would be the new patient, so the majority of the process map would be written out from his or her perspective.
Create the process map
Three levels are involved in creating a process map:
Level 1: A simple line → Many simple processes aren’t much more than a list, but it can be helpful to see the steps of a process in a visual format. It is especially useful if the instructions are posted somewhere very visible, such as on a wall or the machine being used. For this type of map, write out sticky notes for each step and line them up either from top to bottom or left to right. We’ll use the example of developing X-rays for what a simple process map should look like (Figure 1).
If your practice is like most, not every team member is 100 percent confident with every machine, procedure, and process in the office. Simple process maps can be placed to help create a lean “visual workplace.” This minimizes the time team members waste checking the correct ways to do processes they don’t perform regularly.
A visual workplace also helps minimize shortcuts that can hurt the overall performance of the practice.
Even if your team is very familiar with your office’s day-to-day operations, imagine how much easier it would be to integrate new team members with training materials that are this straightforward! Instead of worrying about what they don’t know, new team members are empowered to learn as they go, using materials that are at their fingertips whenever they need them.
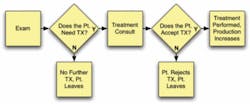
Level 2: Making decisions → Sometimes when making process maps, there is a step that requires multiple options or decisions, which causes the flow of the process to change. To represent these decisions, simply rotate the sticky note 45 degrees for a diamond shape, and write the different options in the corners.
In our monthly service, we calculate the production per exam as a simple way to track treatment presentation and acceptance. In this example, different outcomes are reached based on the patient’s decisions (Figure 2).
Six Sigma, the leading quality-control methodology, uses process maps when analyzing a business to ensure that the desired outcomes are met. By stripping away everything but the outcomes and the critical decisions that lead to those outcomes, process maps isolate variables that can be measured and controlled.
A simple approach that could benefit your office immediately would be to measure the ratio of overall production to the number of exams performed monthly. If that number drops, you can look at the two decisions in the process: how much treatment is being presented to patients and how much treatment they are accepting.
Some of the reasons for drops in these numbers can be traced to an obvious cause, such as staff turnover, a drop in new patients, or a change in how cases are presented; however, sometimes the reason isn’t quite so obvious.
During the “back to school” season in August, many offices are so busy with exams that there’s no room to schedule additional treatment. Fortunately, once the schedule opens up again, these offices usually show a large jump in production from built up treatment diagnosed in the previous months.
For these offices, we suggest planning ahead when scheduling major treatment. Book appointments that would normally be scheduled in August in July or September, when there is more availability. This allows you to take full advantage of the jump in demand without compromising the office’s ability to provide major treatment. This is just one example of how you can revolutionize the management of your practice by using tools that give you a process-based, systemic view of the practice.
Level 3: Simultaneous actions → Because steps can occur simultaneously, it helps to be able to differentiate them. You can use different colored sticky notes for steps that branch away from the primary focus. Here is an example of a routine cleaning and exam, where the step of the assistant developing the X-rays branches off and rejoins the main process later (Figure 3).
There are two benefits to looking at how simultaneous actions relate in a process. By showing everyone’s role in the bigger picture, you can help foster teamwork and decision making while emphasizing value to the patient. From patients’ perspectives, anything outside of their views is not “value added,” nor does it directly benefit them. From their perspectives, as long as the X-rays are developed before the exam, they don’t care how they were developed. In fact, one of the main tenets of lean methodology is to reduce wasted time on steps that do not directly benefit the customer.
The above example can also clarify this idea. By having an assistant develop the X-rays instead of a hygienist, the patient receives continuous care throughout his or her visit.
Offices that use digital X-rays can take this one step further. Digital X-rays remove the wasted time of developing X-rays.
In addition to the benefit of increased efficiency, the work flow appears effortless, improving what matters most to patients — their experience in your practice.
Finalize the process map
Now that you have a prototype of a working process map, it’s a good idea to have someone unfamiliar with the process read through it. If that person can easily understand it, then you’re on the right track.
It’s also a good idea to keep the same level of detail in each step to make sure that you’re focusing on the process and how the steps relate. A good example is shown in Figure 3, where the nitty gritty details of “assistant develops X-rays” aren’t necessary to understand the overall exam process. Instead, those details are shown in Figure 1, where they help team members remember each step of using the machine.
Once you’re happy with the layout of the sticky notes, draw arrows between the steps. These remove ambiguity, especially when working with multiple decisions and simultaneous paths. Once the process map is finalized, it’s time to make it presentable.
There are three options for making your process map presentable, depending on your taste and resources:
- Take a picture of the final process map and print it.
- Have an artistically inclined team member draw it out by hand and laminate it.
- If available, use a program designed to create process maps, like Visio or OmniGraffle.
The benefits of process mapping with your team
While you can process map alone, it is more beneficial as a team. By using this systems-based approach, the focus is removed from individual performance and placed on working toward a streamlined, easy-to-run practice.
Because everyone has different backgrounds, education, and job positions, they will also have a unique interpretation of the steps and goals involved. Combining these views into one unified process map will help everyone better understand “what is expected at work” and how their position relates to that of other team members.
As you and your team become more comfortable with process mapping, you’ll notice one more hidden benefit ... it is much easier to train and integrate new team members when you have a picture of “the full elephant” to show them!
Dr. Joseph O’Donnell is a former contributing editor for Dental Economics® and is the author of Hometown Hero: An Action Guide for Solo Practitioners. He maintains a full-time practice in the Chicago area. Brett O’Donnell is a management systems engineer who has published peer-reviewed research for the Institute of Industrial Engineers. Through his business, he has brought the science of systems engineering to the health-care field. More than 1,000 dental offices are using the materials outlined in this article. Reach them at (877) 777-5509, via e-mail at [email protected], or visit www.springboardbusiness.com.


