From late July through early September 2021, DentalPost and Endeavor Media, including Dental Economics and RDH magazines, partnered to conduct the largest and most comprehensive dental professional salary survey of its kind. From compensation to work environments to the job turnover rate, here are some of the key numbers and insights from responding dentists and dental team members.
The dentists who responded
Of the 13,036 dental professionals who responded to the survey, 1,231 were dentists.
When compared with American Dental Association Health Policy Institute (ADA HPI) numbers, our respondents proportionally overrepresented the age groups 55-64 and 65+ by 16% and underrepresented the age groups under 35 and 35-44 by 17%.
Our respondents roughly matched the percentages of female and male dentists in the US reported by ADA HPI. They also roughly matched the percentages of dentists employed in private and corporate practices, and the racial/ethnic percentages, with the exception of Asians and Pacific Islanders, who were underrepresented by 4%.
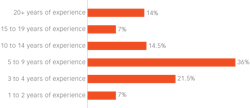
69.5% had 20-plus years of experience. This is important to note as we consider the average salaries presented throughout the report. The remaining 23% of respondents had five to 19 years of experience, while 7.5% had one to four years of experience.
Also from DentalPost
Survey: COVID-19 compounds dental staffing challenges
85% work in private practice. The vast majority of respondents work in privately-owned practices, with 7% reporting they work in corporate practices, 4% in public or community health positions, and 4% in all other types of clinical employment.
88.5% are general dentists. Only 11.5% of respondents identified as dental specialists. This underrepresents the percentage of working specialists reported by the ADA HPI, which is 21.2%. Despite their relatively small number, enough responded to provide a salary snapshot.
75.5% own or are a partner in a practice. Among respondents, 64% of women dentists own or partner in a practice, and 80% of men dentists own or partner in a practice. 36% of those transitioning to owner or partner have five to nine years of experience (figure 1).
How they work
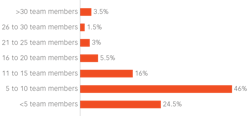
46% work with five to 10 team members. Only 8% of respondents work in dental practices with 21 or more team members, and 86.5% of dental practices with 16-plus team members are privately owned (figure 2).
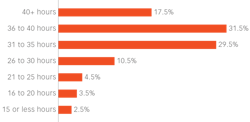
17.5% of dentists work more than 40 hours per week. 39% of responding dentists would prefer to work fewer hours per week (figure 3). 41% of male practice owners work more than 35 hours per week, and 69% of female practice owners work more than 35 hours per week.
How they are paid
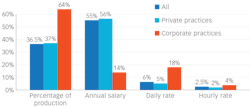
There is a difference in the basis of dentists’ income between private and corporate practices and between associate/employee dentists and dentists who are owners/partners of a practice (figure 4).
In private practices, 63.5% of practice owners/partners reported their income is based on an annual salary, and 70% of associate dentists reported their income is based on percentage of production. In corporate practices, 60.5% of owners/partners reported their income is based on percentage of production, and 67% of associate dentists reported this income is based on percentage of production.
How much they make
The income range of full-time dentists is broad. Respondents working more than 30 hours per week reported incomes ranging from $121,750 average income for two respondents right out of school and going up to $725,000 for nine general practice owners working 40-plus hours per week who pay themselves a percentage of production. Six of the nine highest producers provide implant services.
The responding 72 specialists reported average total income of $354,608 from clinical practice. Their median income was $230,000. General dentists reported an average total income of $272,780 from clinical practice with an average base salary of $217,620 and a median total income of $230,000. General dentists who own their own practice or partner in a practice reported an average total income of $298,020. General dentists who are employees of a practice reported an average income of $191,790.
The impact of implant services on income is high. Full-time general dentists who provide implant services reported an average income of $355,570 with a median income of $275,000. Full-time general dentists who do not provide implant services reported an average income of $242,558.
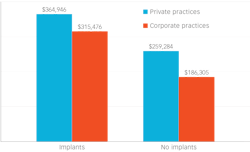
In corporate practices, where a greater ratio of dentists are paid a percentage of production, the impact of performing implant procedures is greater. Implant dentists in corporate environments make, on average, $129,000 more than corporate dentists who do not perform implant procedures. Among private practice dentists, the average income difference between implant dentists and non-implant dentists is just over $105,000 (figure 5). General dentists who are implant dentists make, on average, over $100,000 more.
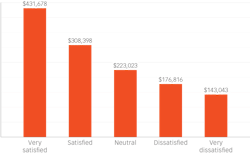
60% received pay increases in the last five years. Despite the pandemic, 38% reported receiving a pay increase within the last two years. 58% of the responding dentists reported being “satisfied” to “very satisfied” with their income. Those who reported dissatisfaction reported income that is below the mean ($272,780) and median ($230,000) for all responding general dentists (figure 6).
Most do not receive bonuses. Three out of four dentists in both private and corporate practices do not receive bonuses. The bonuses of those who do are mostly based on production (53%) or defined goals (24%). More than 25% of bonus earners were expecting annual bonus totals of more than $50,000 each in 2021.
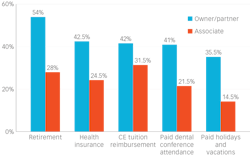
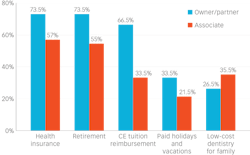
Most receive employee benefits. This year we asked dental professionals which employee benefits they receive. Responses varied based upon whether a practice is private or corporate and the dentist is an owner/partner or employee. More than 50% of dentists receive retirement benefits as part of their compensation. Only 8% of associate/employee dentists in corporate practices do not receive benefits, compared with 25% in private practices (figures 7 and 8).
Dentist job stability
Dentists are relatively stable in their employment. Only 10% of dentists intend to look for a new situation in the next year, and 62% of the 10% are under age 45. 46% reported they plan to retire within the next 10 years, with 25% planning to retire in the next four years. A relatively small percentage (16%) of those who plan to retire in the next four years are currently under age 65. 25% of dentists who are currently 65 years of age or older plan to work another five to 10 years.
Turnover of team members
At the same time we were surveying dentists, we were gathering responses from thousands of dental hygienists, assistants, and administrative team members. Here are some up-to-date key insights into staff turnover.
Dental hygienists: Our survey tells a story of rising wages and income satisfaction this year over last year, with 72% of this year's RDH respondents indicating they are satisfied with their income and hours. None of our 6,000-plus RDH respondents indicated they were thinking of leaving their profession.
Dental assistants: Retention of dental assistants is at considerable risk. 70% of dental assistants have been with their current employer for four years or fewer, and 26.5% plan to seek a new job within one year. Why do they want a new employer? Being underpaid is top of mind (42% of comments), followed by longing for a more respectful and appreciative work environment (30% of comments).
Office managers: 31% of responding office managers work more than 40 hours a week. Despite 71% receiving a wage increase in the last two years, 42% are unhappy with their income, and 14% plan to look for a new dental office management position.
Front desk team members: Front desk team members are the most vulnerable to job turnover, and comments indicate many feel they are unappreciated and expendable. Only 23% have been with their current employer for 10 or more years. In the last year, 39% looked for a new job, and 32.5% plan to look for a new job in the next year. Despite 66.5% receiving a wage increase in the last year, only 26.5% are satisfied with their income.
Billing specialists: Billing specialists follow front desk team members in the number who will be looking for a new job this year (30%). The most expressed sentiment among these professionals is frustration about hitting their income ceiling.
Many more details from this year’s Dental Professionals Salary Survey can be found at dentalpost.net.
Editor's note: This article appeared in the January print edition of Dental Economics magazine.
About the survey creator and copromoter. As the largest dental job board in the industry, connecting 900,000 dental employees with 70,000 dental practice employers, DentalPost is uniquely positioned to partner with Dental Economics and RDH in keeping dentists and practice owners informed of the latest data and survey results surrounding compensation, working environments, hiring, and career decisions. Founded in 2005 by registered dental hygienist Tonya Lanthier, DentalPost leads the dental industry in metric-based career matching, including personality tests, work culture preferences, skill matching, and career goal assessments. Learn more about DentalPost and view the comprehensive 2022 Salary Survey Report at dentalpost.net.
About the Author

Tonya Lanthier, RDH
TONYA LANTHIER, RDH, is the founder and CEO of DentalPost, the dental industry’s premier and largest online and mobile job board. A registered dental hygienist turned entrepreneur, Tonya has gained acclaim industrywide for her passion to improve lives and help dental professionals build teams that excel through metric-based career matching tools, including personality tests and values, skills, and work culture assessments.

